SLA Dashboard
Navigation: Sidebar → SLA
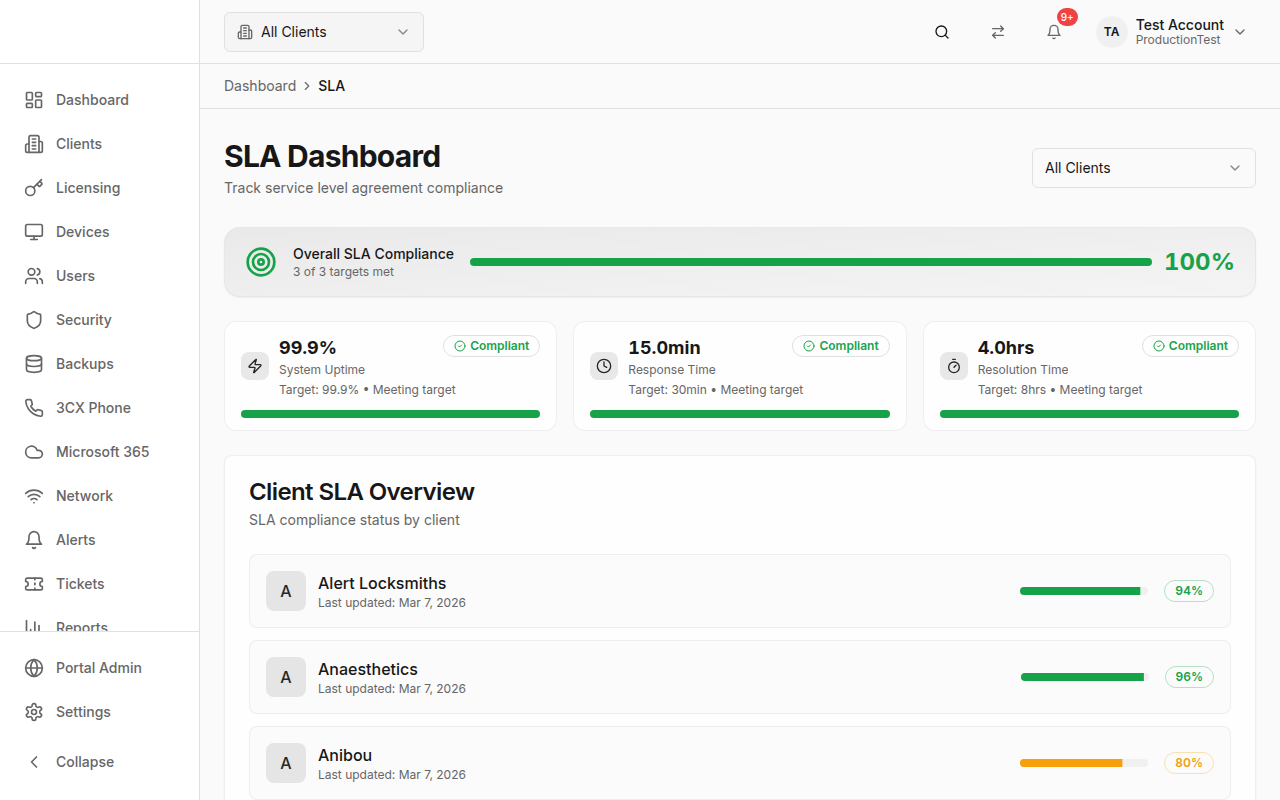
The SLA Dashboard tracks your Service Level Agreement compliance across three key metrics: system uptime, response time, and resolution time. Monitor overall compliance, identify at-risk targets, and review per-client SLA performance.
Overview
The SLA page provides:
- Overall Compliance Score — Percentage of SLA targets being met
- Metric Cards — Individual scores for each SLA target with progress bars
- Client Breakdown — Per-client compliance percentages
Overall Compliance Score
A prominent score card at the top shows your overall SLA compliance:
- Score — Percentage of targets met (e.g., "100%" = all targets met)
- Subtitle — "X of Y targets met"
- Progress bar — Visual indicator
- Color coding — Green (≥90%), Yellow (70–89%), Red (<70%)
SLA Metrics
Three metric cards track your key SLA targets:
System Uptime
- Target: 99.9%
- Actual: Calculated from uptime metrics
- Unit: Percentage
- Higher is better
- Compliance: actual ≥ target = compliant
Response Time
- Target: 30 minutes
- Actual: Average first-response time
- Unit: Minutes
- Lower is better
- Compliance: actual ≤ target = compliant
Resolution Time
- Target: 8 hours
- Actual: Average time to resolution
- Unit: Hours
- Lower is better
- Compliance: actual ≤ target = compliant
Status Indicators
Each metric shows a status badge:
| Status | Meaning | Color |
|---|---|---|
| Compliant | Meeting or exceeding target | Green |
| At-Risk | Within 10% of breaching target | Yellow |
| Breached | Below target threshold | Red |
Progress bars show how close you are to the target, with colors matching the status.
Client Selector
Use the Client dropdown in the header to view SLA metrics for:
- All Clients — Aggregate metrics across your entire client base
- Specific Client — SLA performance for a single client
Client SLA Overview
A table showing every client with their compliance score:
- Client name with initial avatar
- Last updated date
- Progress bar — Visual compliance indicator
- Percentage badge — Compliance score with color coding
This is useful for identifying which clients are at risk of SLA breaches.
Tips & Best Practices
- Review SLA metrics at least weekly — Catch trends before they become breaches
- Focus on "at-risk" metrics — These are about to breach and need immediate attention
- Use the client breakdown to identify problematic clients — Some clients may consistently pull down your averages
- Set realistic targets — SLA targets should reflect what you can actually deliver
- Track response times — This is often the first metric to slip when your team is overloaded
- Include SLA data in client reports — Use the Reports page to generate SLA compliance reports for QBRs